Friday, April 10, 2009

Product Strategist: Aspect-Oriented Programming

Out on Twitter earlier this week, Scott Sehlhorst mentioned something about Object-oriented programming (OOP), so I added Aspect-oriented programming (AOP) to his list. Then, we tweeted about that. He asked for my blog post on this subject. But, with my blog host down, I'm at a loss as to where to point him. So today, we will explore AOP, and more particularly, what it means to product strategy.

AOP originated at IBM. Initially it focuses on cross-cutting concerns like security that turn up in our non-functional requirements, as opposed to our functional requirements that describe the logic of the automated and automating domains implemented via OOP. Java extensions supporting AOP exist.

AOP in non-invasive. OOP provided a huge improvement in encapsulation, or coupling and cohesion, over structured programming. Encapsulation puts code inside black boxes. AOP doesn't mess with the stuff inside those black boxes. The messaging of OOP happens outside the encapsulations. AOP intercepts messages, triggers processing in the AOP code, and then sends the message, unchanged, on to its intended recipient, so the execution of the OOP code continues uninterrupted, and unchanged.

As product managers, we have to remain non-invasive with respect to the implementing performed by our team members. Cross-cutting concerns can be left to your technical architects. But, when it comes to long-term maintenance, evolution, and testing, AOP offers distinct advantages to the software vendor.

When your team finds bugs, they get invasive to fix the bug, and introduce other bugs. A bug fix doesn't necessarily reduce your bug count. A bug fix may insert more bugs than it fixes. QA does full regressions after bug fixes, because you never know where a bug will show up in once clean code. Those full regressions are limited by your budget. They only reach so far. And, we all know that there is always another bug. Hackers are actually testing your application beyond the economic limit (budget) of your company. Hackers have no economic limit, so they will find the next bug before you or your customers do. AOP can help here.

If bugs are corrected non-invasively, that clean code never has to have the same tests run on it again. So instead of using your test budget on the same old tests, you get to run new tests that test deeper and wider and expand the reach of your economic limit. You would have to create new tests for the fix, but the scope of those tests would be much narrower than those run in a modified full regression.

Your application would take on an object-within-an object architecture. OOP already can be viewed that way. JavaScript in its DOM processing is organized in this manner.

You would code the core functionality. Once released, the next upgrade would be coded as a non-invasive extension where AOP would provide the integration between the core and the upgrade layer.

In this figure black represents the core code or initial release. The blue represents the subsequent release. The red represents the AOP interface between the core code and the code for the subsequent release.
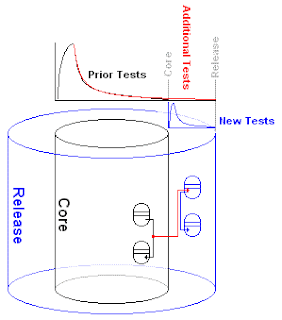


In this figure, the curves from the regression tests have been added. While coding the subsequent release, additional tests were run on the core code. The code for the new code is tested as well.

The regression curves in the figure reflect a reduced test budget. If the test budgets were held to ordinary issues the volume of tests would be some multiple of that shown for the prior tests.

The economic limit of the firm, shown in gray, can be moved from the testing bought in the initial release to additional test coverage bought during the upgrade effort.

AOP can reduce time, money, customer dissatisfactions, and emergency efforts focused on security issue responses. Consider AOP a strategic option. Explore it today.


Any comments? Leave them here, or email them to Dave44000@yahoo.com. Thanks.

Monday, April 6, 2009

Alignment

One of the best ways to build your team involves getting them aligned with the goals of your team. It's not something that happens in startups.

It did happen long ago in the big corp, because we had to write MBOs. The organization had goals. We had goals. If we could find a way to frame our goals in terms of the organization's goals, we won. Aligning centers around this framing.

One of the prerequisites is knowing your people. I can remember how one manager hired a friend, and then gave them the coolest project to work on. But, the friend didn't think it was cool. He hated it, because it detracted from the skills he felt made him valuable. He was never going to use the skills he had to learn while working on that project. I would have seen it as a growth opportunity. I knew more about it than my coworker. I provided the contact info for the external contractor we used for things beyond the co-worker's scope. The coworker was ready to quit over the assignment. Alignment was messed up across our team, because someone was taking care instead of giving care, but more importantly, because the manager didn't know his people, even his friend.

Alignment doesn't mean that everyone will pull in the same direction, or for the same reasons. But, everyone can make a contribution through their own alignment.
The figure shows how a team aligns around the goal of getting the product shipped. You can substitute department names if you like.

The point is what the people get out of the work, out of their contribution. They should be serving themselves, as well as their line manager and functional unit.


This gets particularly messy if a team member is assigned to several projects and contribute only a small proportion of their effort to your project. Regardless, you might find that your team members give you more than they give those other projects if you and them have gotten alignment on their goals where other managers have not.

The better you know your team members the better able you will be when you help them to achieve alignment with team goals.

The better you know your peers and members of all of your contributing functional units, the better able you will be to get alignment with them. It's not so much knowing the function, and knowing the role of that function in your firm as much as it is knowing them as people. They can buffer the typical organizational conflicts if they see that as being in their best interest.

To find the time to know your people, never eat alone, and manage by talking around. And, don't talk project. Talk to the person. Management talk in the office, leadership talk everywhere.

And, please, don't ask me how "I" am if you want a project status. "I" am not your project. Unless, you're a bud, I'll say I'm fine, even if ....

If you don't think you have time, you really don't have time not to.

Leave some comments people!


Thursday, April 2, 2009

Blue Ocean Strategy and the Technology Adoption Lifecycle

I finished "Blue Ocean Strategy," http://bit.ly/acHSD recently in advance of the next meeting of the Smarter Product Managers book club, hosted at http://www.booksprouts.com/. I tweeted about finishing the book in the #pmv and #prodmgmt tweet streams after which a discussion broke out. The discussion centered around the difference between a blue ocean, red ocean, and white ocean.

The book defined the red ocean as the commodity goods market. The blue ocean boils down to a hybrid ocean consisting of elements from red ocean goods and services targeted to non-buyers of the firms previous red ocean market. The white ocean wasn't really described in the book, but came up in the twitter discussion as a brand new market. The twitter discussion defined a white ocean as an ocean created by technological innovation. The book was big on how technological innovation could not persist these days, so it provided no real business proposition. This to set the stage for the need for value innovation.

The business community typically sees disruptive innovation as being very risky. But, that risk originates in the red ocean tactics that are typically used, and which really don't suit a disruptive innovation.

A blue ocean strategy would be an alternative to value-basing, mass customization, relationship marketing, demand-side services, and launching a new technology into a battle for market leadership of a new category. The whole blue ocean discussion centers on the creation of a new category without disruptive technology.

Since I think in terms of disruptive technology, I put everything into the context provided by Moore's technology adoption lifecycle. It contextualizes the category from birth to death. Moore's late market turns out to be the red ocean.


This figure shows Moore's technology adoption lifecycle as being the small normal curve to the left. The larger normal curve represents the category after it has been acquired by a large blue chip company.


The small curve would represent the Internet back in the dot boom. The larger curve is the Internet after the telcoms bought up the once disruptive Internet companies. In one particular report this larger market was ten times larger than the initial market.
In the diagram, I annotated the red oceans that the category or market is characterized as. The blue arrows show growth anticipated in each category. One a category enters the late market, growth is at an end. The contraction in the market is demonstrated by the brown arrow in the larger blue chip market. This lack of growth motivates the construction of a blue ocean strategy.
Moore talked about growth ending on the entry to the late market. Price-based competition begins earlier. As shown in the next figure.


It is price-based competition and the proliferation of fast followers that drive growth negative. On the figure the gray area on the left represents the tornado. The tornado is where the fight for market leadership is fought. The market leader emerges from the tornado with an advantage over the rest of the field. The yellow area depicts where price-based competition and fast following begins. Again, the late market is depicted as a red ocean.


The blue arrow depicts the interval where the most rapid growth occurs. This is also the best place to IPO. If your IPO is delayed into the red ocean region, you will find that the premium paid on your IPO falls to zero. There is no upside in the red ocean. The expectation is that you will make lower returns in the red ocean.
The far left portion of the disruptor's normal curve (white area under the curve) shows where any white ocean or new market or category is created though disruptive technology.
So you find yourself in the red ocean, and it's time to construct a blue ocean.

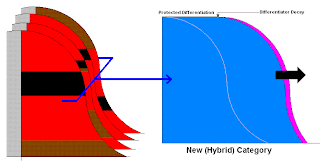
First, you find an unserved population. Then, you take capabilities in your current business, extend them (black), throw some away (red), and add capabilities (brown) from other red ocean categories together to form a new hybrid (blue) category that serves that unserved population.
A disruptive technology would likewise seek and serve an unserverd population, unserved by the current categories, or over served customers in an existing category(Christensen). This sets Moore's technology adoption lifecycle as a competitor for blue ocean strategy formation.
The red ocean became red as differentiation was wrung out by competition and the convergence of competitors and their co-evolving markets. Competitors eventually emerge in a blue ocean and gradually turn it red, as depicted by the purple edge to the right of the blue ocean.
The book talks about how the blue ocean can be extended through IP protections and hard to copy capabilities.
The book establishes three criteria for blue ocean formation. More on this in a later post.
What do you think? Leave a comment. Thanks!


Thursday, March 26, 2009

Fequency of Use vs Ease of Use

It's easy to be easy when your software only does one thing. It's easy to be easy when your software only serves one user, or a homogeneous collection of users with the same backgrounds who attrbitute the same meanings to things. These situations are not typical.

Instead, we face a long list of things our software must do, a long list of ways the software must do it, and a heterogeneous collections of users who different things, play different roles, and don't share background or meanings. This makes achieving ease of use across all features or tasks impossible. We face the tradeoff between the number of features and ease of use.

One way to make an informed tradeoff is to look at the fequency of use of the features or tasks. To do this we record use over a long period of time. It will turn out that certain features are used all the time like opening a file and saving a file, and that other features are rarely used. If we recorded the use of a single user, we end up with that user's statistical distribution of use. If we do that for many of our users, we ed up with a statistical distribution of their aggregated use.

If we order the frequency of use by frequency, we end up with something approximating a power curve or "The Long Tail," as shown by the black line in the figure below. Then, we can design an ease of use curve, as shown by the red line.

If the most frequently performed tasks are the easiest, the average ease of use will be low. If the least frequently performed tasks are hardest, again, the average ease of use will be low. In some sense the intimidation of the harder tasks will provide the administrators with a benefit. The causal user won't go in and mess around with things.
An alternative would be to partition the functionality around roles, uses, and meanings. Consider MS Word back when it competed, in the legal industry, with WordPerfect, the market leader. MS Word provided a function key mapping feature that enabled word to match WordPerfect keystroke for keystroke. Legal secretaries were touch typists that worked at 200 words per minute or better. They would never touch a mouse. That was too slow. If you were not a legal secretary, you wouldn't use this feature of MS Word, because you couldn't remember the function keys. The feature required you to dig around to turn it on. After that, you just did what you always did the same way you always did it. MS Word eventually took over the WordPerfect space in the legal industry.
MS Word provides many other examples. How may of us use mail merge? Or, fields? Or, bookmarks? Most of us just type in the words, do some formatting, do a spell check, and save the file. There is so much to MS Word that we never use.
MS Word also demonstrates how an application can be partitioned into two applications. It used to be that MS Word could do anything that you could do with a desktop publishing application. You could set up a grid. You could simulate embossing. Microsoft did not have a desktop publishing application. The eventually decided to enter that market with MS Publisher. At that point MS Word became a blunt instrument. MS Word's font metrics couldn't enforce a grid any longer. So MS Word is less capable today. If you want to do desktop published quality work, you move over to a desktop publisher, and only type up the words in MS Word. Sad.
MS Word also demonstrates the task sublimation that Moore talked about as a necessary step when entering the late market. MS Word, today, is a non-geek, tool. With task sublimation, you don't give up power. You only give up feature bloat, or control. That's the idea. MS Word doesn't live up to this ideal when you compare the current versions with MS Word for DOS 5.0, yeah, a dinasour.
The point of all of this is that you can design an allocation of ease of use that simultaneously fits different populations of users, fits different ease of use segmentation schemes, or gives the broadest collection of features or tasks, the perception of ease of use.